
Overview
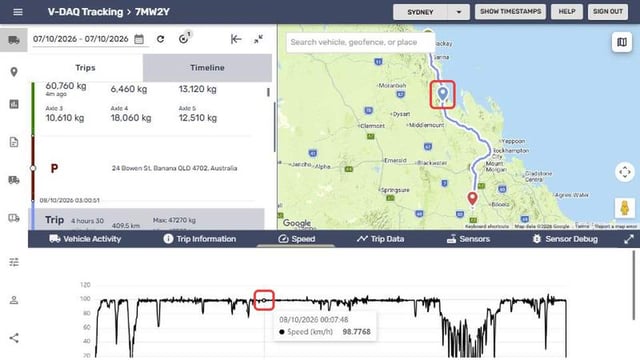
Once you select a trip, a data panel below the map shows the trip's speed, raw telematics fields and a trip summary. Selecting a point on a graph shows where the vehicle was at that moment.
Before You Begin
Before you start, make sure you have:
- Access to the V-DAQ platform.
- At least one vehicle or asset in your account.
- A trip selected on the Trips tab. See View a trip.
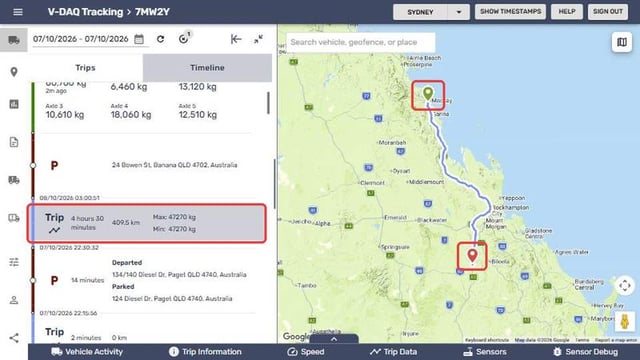
Step 1 – Select a Trip
Open a vehicle and select a trip on the Trips tab.
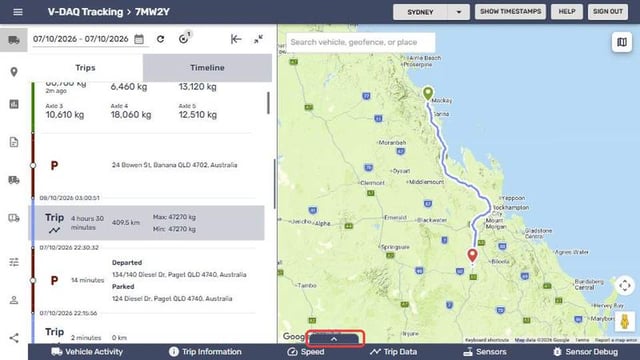
Step 2 – Open the Data Panel
Select the up-arrow tab at the bottom of the map.
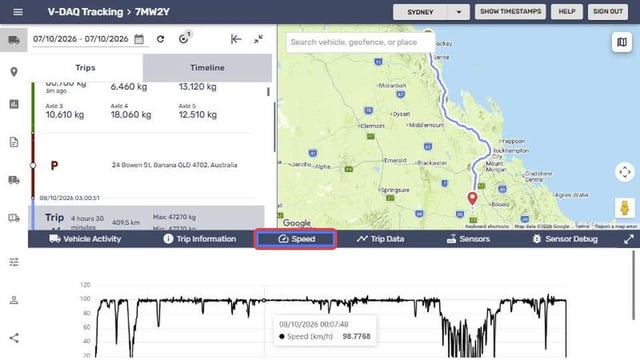
Step 3 – View the Speed Graph
Select Speed to see speed in km/h across the trip.
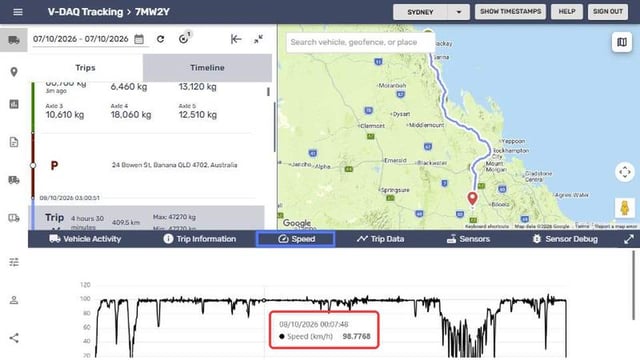
Step 4 – Check an Exact Reading
Hover over the graph to see the exact time and speed at that point.
Step 5 – Find the Point on the Map
Select a point on the graph. The map shows a marker where the vehicle was at that moment.
Step 6 – Graph Other Data
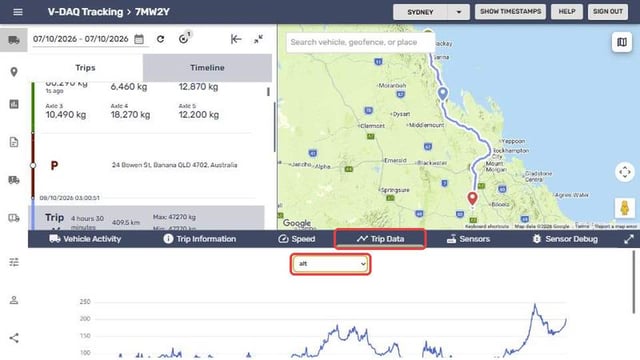
Select Trip Data, then choose a field from the Select Data Source drop-down.
Step 7 – View the Trip Summary
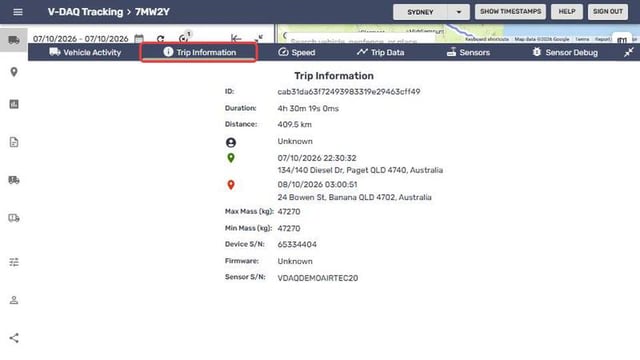
Select Trip Information. Select the expand icon on the right of the tab bar for a larger view.
| Tab | What it shows |
|---|---|
| Vehicle Activity | Live details for the vehicle: registration, position, distance, time driving, trips driven and driver score. |
| Trip Information | Trip ID, duration, distance, driver, start and end time and location, device serial and firmware. |
| Speed | Speed over time for the selected trip. |
| Trip Data | Detailed telematics fields over time. The fields available depend on the device. |
Related Articles
Need More Help?
If you're still experiencing issues:
Phone: (02) 4204 8472
Email: support@v-daq.com.au